PMI’s geospatial analysis program provides an enhanced approach to environmental stewardship. It helps us to map, monitor, and manage our impacts and dependencies on natural capital within our value chain.
The aim is to further our efforts to preserve nature, halt deforestation, protect biodiversity, and manage water responsibly. It is also a strategic enabler for business preparedness and continuity in the face of emerging regulation.
Spatial data empowering informed decisions
Geospatial analysis involves the collection, integration, and visualization of spatial data to understand patterns, relationships, and trends in a geographic context. Thanks to advances in satellite imagery, remote sensing, and geographic information systems (GIS), it has evolved significantly in the last few decades, particularly with the advent of more sophisticated data processing tools.
Today, geospatial intelligence is employed across various industries, including environmental management, urban planning, agriculture, disaster response, and more. Companies, governments, and nongovernmental organizations alike are leveraging this technology to make informed decisions, manage resources more effectively, and respond to global challenges such as climate change. As a result, geospatial analysis has become a tool for those seeking to understand and influence the dynamic interactions between human activities and the environment.

PMI geospatial analysis
Sound of birdsong, followed by background music.
Philip Morris International logo appears, followed by images of nature and people working in fields.
Voiceover: At Philip Morris International, natural resources, and healthy ecosystems are crucial for our business activities.
The raw materials used in our products rely on sustainable managed forests, strong biodiversity, stable climate conditions, and access to water.
In 2020, PMI created its in-house geospatial analysis program in an effort to better understand and consider the environmental risks and social impacts of our agricultural footprint.
Nthabiseng Nooe, Project Lead for Environment Sustainability at PMI, speaks to camera: Geospatial analysis works with maps that are digital.
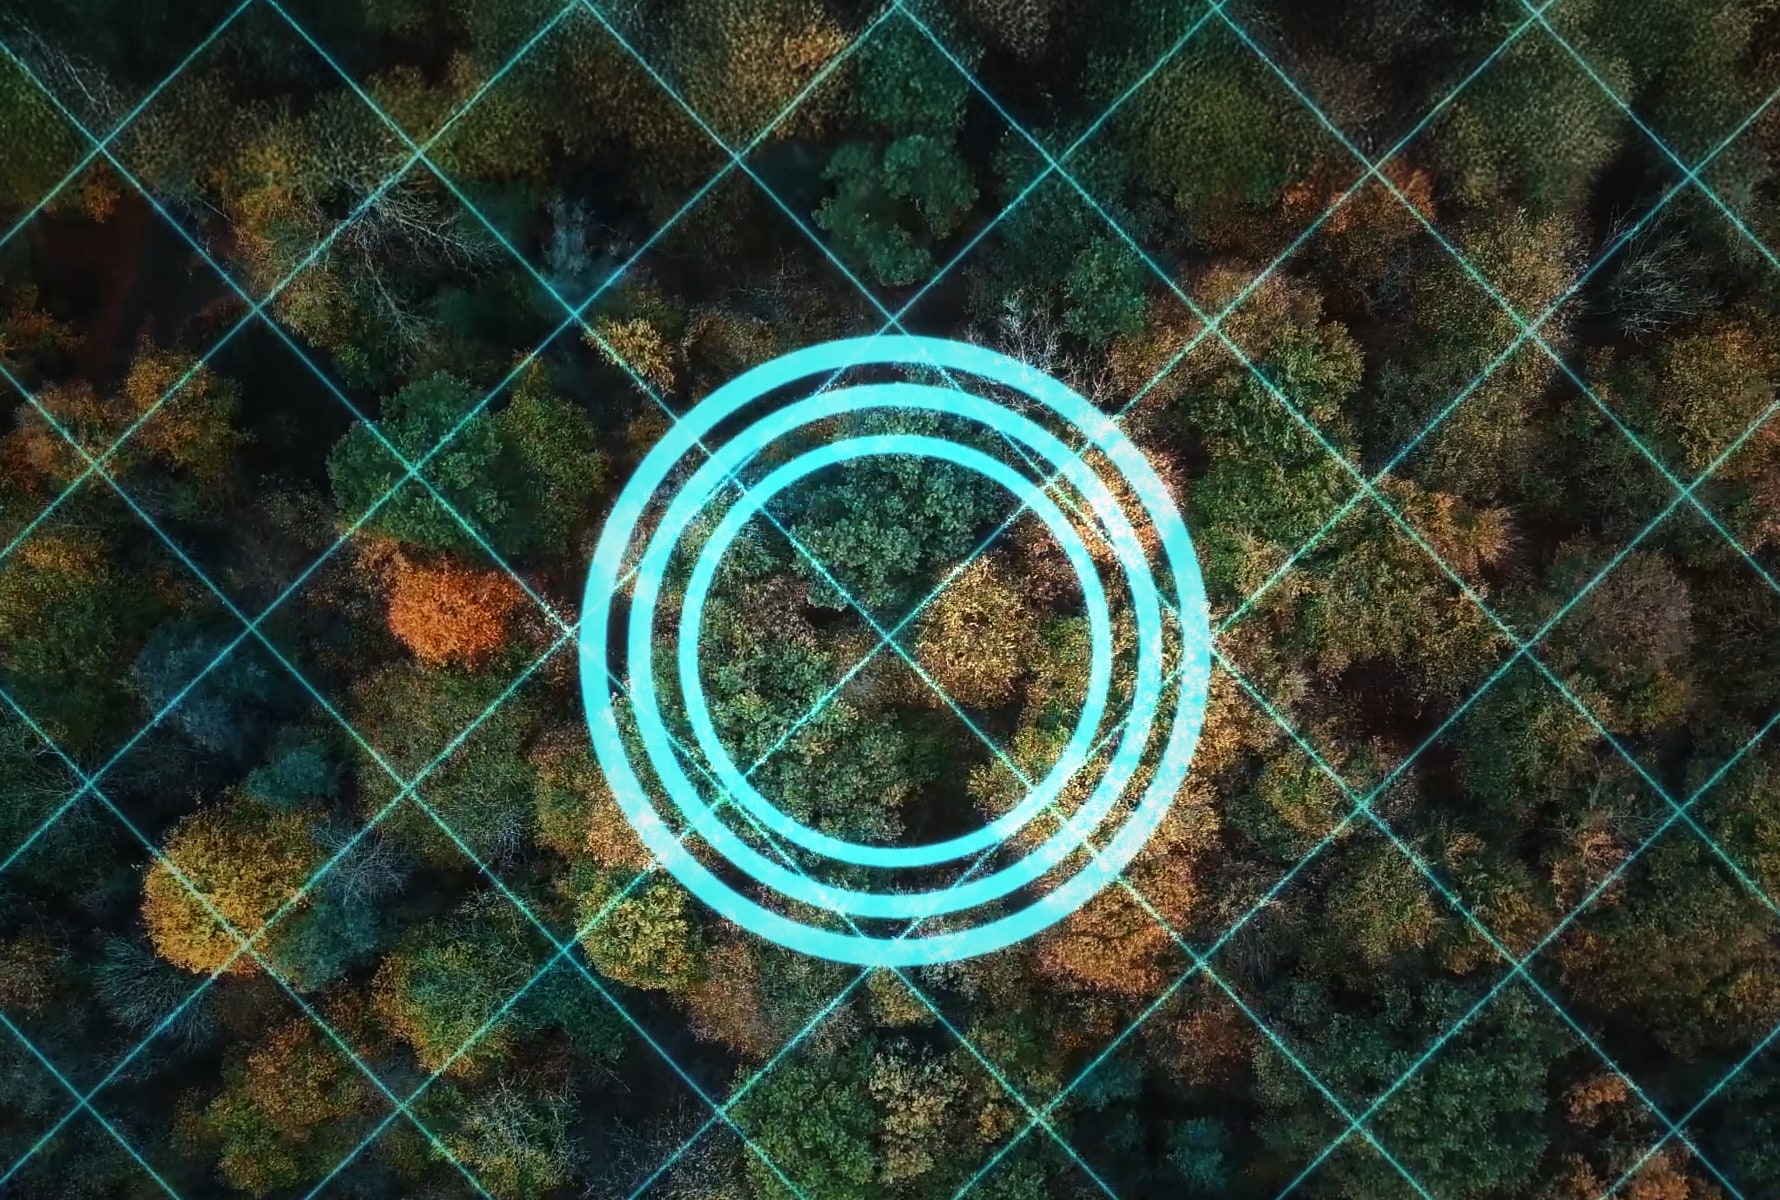
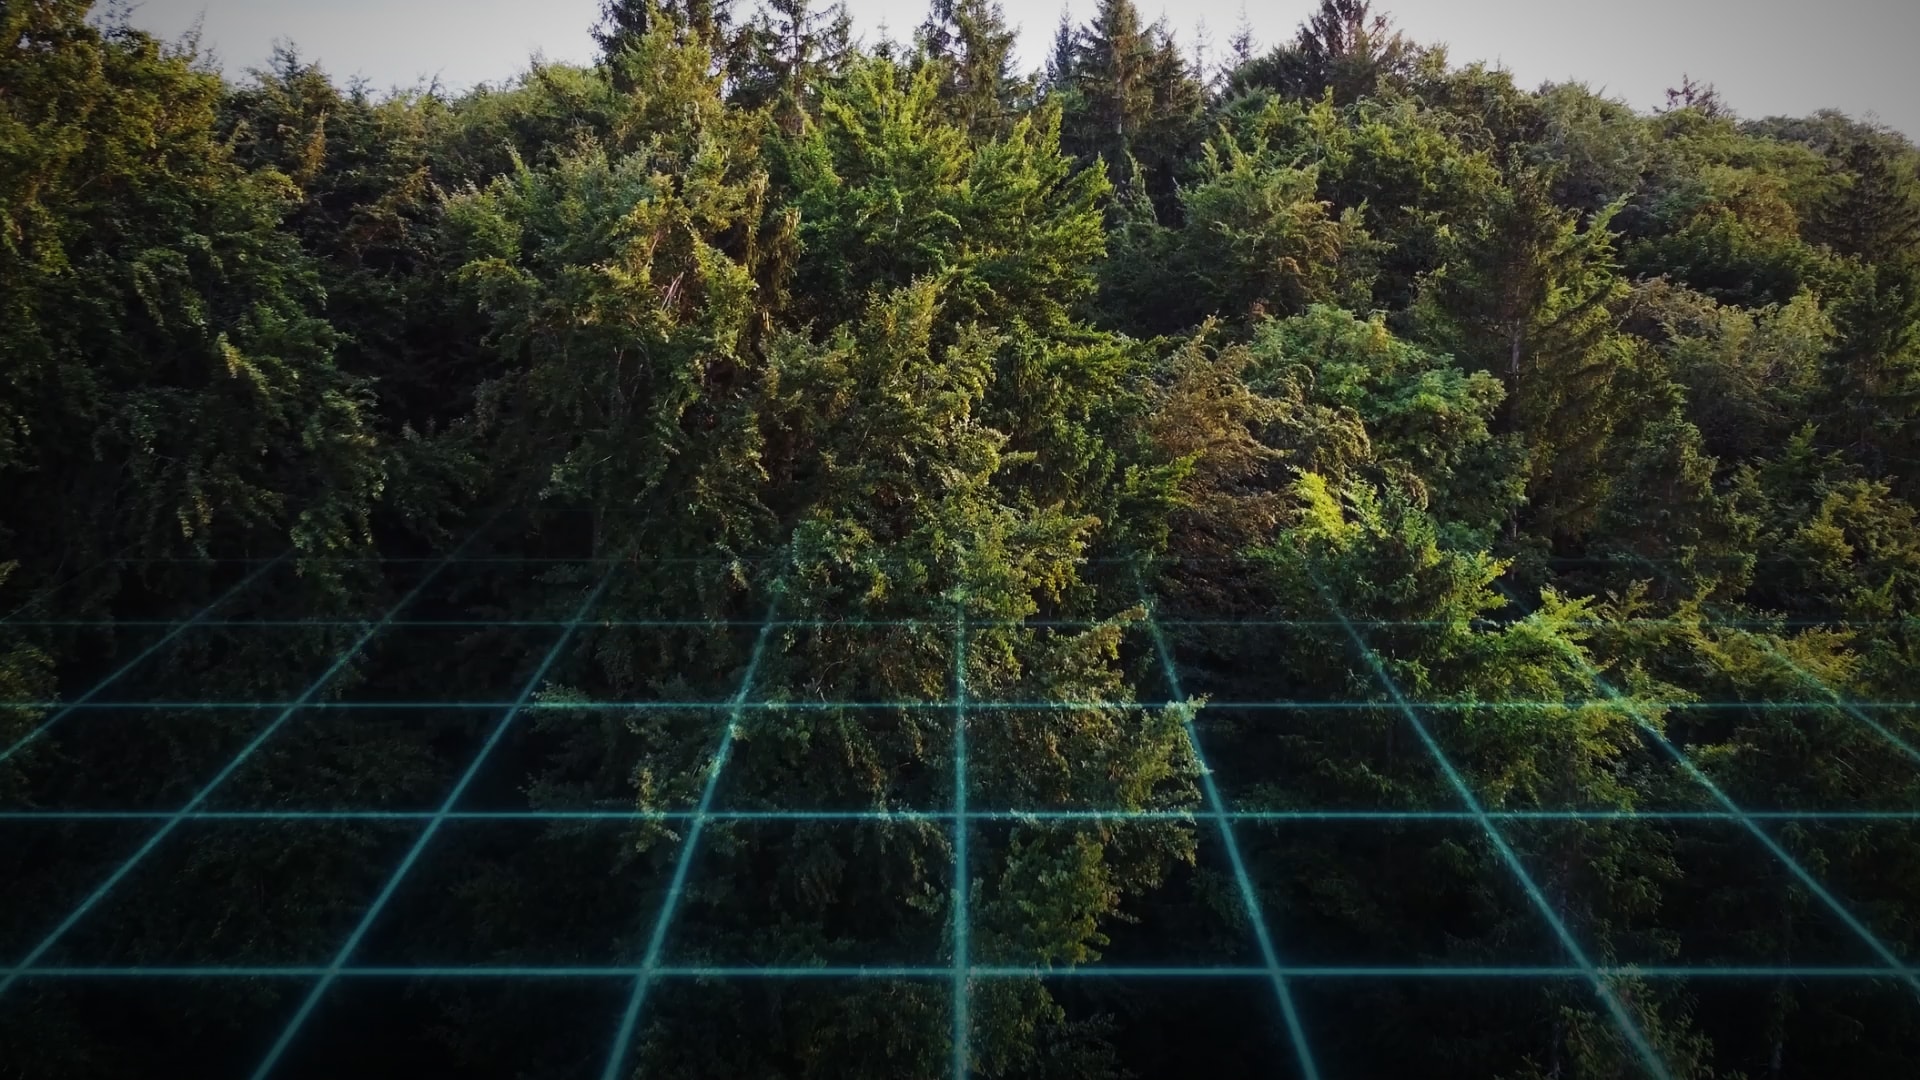
Images of maps, and digital matrices laid over images of forests and agriculture.
Nthabiseng Nooe continues: You also work with data that is extracted from satellite imagery so that you can do earth observation.
Voiceover: The program collects integrates and visualizes data to understand patterns, relationships and trends in a geographic context.
This information provides an enhanced approach to sustainability, supporting mapping, monitoring, and management of our impacts and dependencies.
Images of individuals looking at the camera, along with images of Philip Morris International offices and laboratories.
Voiceover continues: The team, built from a network of technical and sustainability experts, works hard to adopt robust practices that address immediate challenges and anticipate future risks and opportunities.
By integrating advanced technologies like geospatial mapping, we can make more informed decisions, drive innovation, and deploy solutions to avoid and reverse nature loss.
Philip Morris International logo appears.
How PMI is harnessing geospatial intelligence for environmental stewardship
Recognizing the potential of geospatial technology, PMI began building out its in-house geospatial analysis program in 2020, in an effort to better understand and consider the social and environmental impacts of our agricultural footprint. Today, the program plays a critical role in supporting our aspiration to preserve nature—which includes our aspirations to halt deforestation, manage water responsibly, and protect biodiversity.
Specifically, we aspire to:
- Purchase 100 percent of our tobacco, paper, and pulp-based materials at no risk of net deforestation of managed natural forest and no conversion of natural ecosystems by 2030
- Scale solutions toward a positive impact on stressed water resources by 2033, and contribute toward a positive impact on water resources by 2050
- Optimize at least 25 million cubic meters of water (cumulative since 2019) in our tobacco growing areas (TGAs) by 2033
- Achieve no net biodiversity loss across our value chain by 2033, and contribute toward a positive impact on nature by 2050
By utilizing detailed satellite imagery, we can map and measure potential changes in land cover, land use, water resources, and biodiversity richness. This enables us to model how people, objects, and phenomena interact within space, in order to gain deeper insights and take impactful action in areas like product traceability, adherence to PMI’s Zero Deforestation Manifesto, and insights into water and biodiversity risk management.
PMI's geospatial mapping program supports us in delivering more nuanced and actionable data than traditional methods. For example, our program goes beyond simple numbers to provide detailed information on where and how specific nature-related risks might materialize for our business. This supports intelligence across various aspects of our operations providing clear references for the implementation of actions on the ground and reflecting their results as reportable spatial attributes.
Sustainable sourcing, land-use and halting deforestation
At Philip Morris International the raw materials used in our products rely on fertile soil, strong biodiversity, stable climate conditions, and access to water. The degradation and loss of natural capital can cause disruptions and increase production costs.
Through our Zero Deforestation Manifesto, we are committed to safeguarding forest capital across our entire value chain, with a strong emphasis on halting deforestation in the regions where we operate, with a focus on regions where the tobacco we purchase is grown (representing more than 20 countries in 2023) and where raw materials in our pulp and paper-based supply chain are produced (around 50 countries in 2023).
This is because traceability is key.
With a large supply chain like ours, connecting volumes purchased to exact origins can be complex as there may be supply chain fragmentation, incomplete data, and market volatility. In addition, smaller and lower tier suppliers still face pressure to prioritize short-term gains over long-term environmental benefits, making it more difficult to implement sustainable practices in some instances.
Geospatial analysis can help by providing an additional level of granular detail related to water, biodiversity, and deforestation risk. We monitor deforestation risks across approximately 76.4 million hectares of land (a surface roughly equivalent to the size of Chile).
For deforestation risk specifically, we developed a platform that allows us to more frequently directly access satellite imagery.
Through the program, we can:
- Work with monthly satellite data as it becomes available to monitor the areas of interest
- Improve our forest and land monitoring granularity from 30 meters to 10 meters, this means we can see much more closely, and with much more detail, what’s going on at a more granular level
- Differentiate between natural and planted forest through a dedicated algorithm, which helps us understand with better detail the potential impacts and opportunities associated with specific nature-related projects
- Use global alerts to notify us of forest disturbances and are updated on a weekly basis. This helps us to intervene faster where necessary
- Develop a viewer for forest alerts enabling us to calculate land cover changes within areas of interest to assess density of forest disturbances and land cover changes
We have been able to use this system across several specific contexts:
- Carbon sequestration: Geospatial analysis identified potential areas for carbon sequestration improvement, guiding efforts in Brazil to enhance local carbon sinks through our Perfect Forest approach.
- Sustainable sourcing: Assessment of potential tobacco source locations in India ensured alignment with PMI’s environmental targets, influencing sourcing decisions to minimize deforestation risk.
- Land use assessment: Evaluation of farm locations in Brazil helped maintain zero conversion of land use, supporting sustainable practices and compliance with PMI’s goals and exploring opportunities for generation of carbon removals on farm.
Additionally, when a new area is considered for growing tobacco, we can use spatial analysis to assess the deforestation risks or water stress of that land area, which supports in developing mitigation activities if needed.
We can also conduct various assessments related to water, biodiversity, and forest risks to compare the potential new area with existing ones.
Additionally, we use additional data such as:
- Areas where deforestation is starting to happen
- Areas where deforestation has already occurred
- Types of planted forests
- Proximity to key biodiversity areas
- Any local environmental information that helps our teams understand the risk profile before approving a new tobacco-growing area
For instance, in north-east Brazil, where we have a Vertically Integrated (VI) tobacco supplier, we support in the identification of areas that could potentially be added to tobacco farmlands. By using satellite images from the European Space Agency, we compared land use from the baseline year (2019) to the current year. This helped us confirm that no land conversion had occurred in the earmarked areas, meaning the land was still being used in the same way as before.
Map showing the calculated difference of annual European Space Agency (ESA) land cover layers between December 2018 (to cover 1 January, 2019 baseline) and December 2021. Results show that there was no conversion from natural to non-natural cover types in that period, aligned with PMI Zero Deforestation Manifesto.
Map showing the current Area 1 in red alongside the planned expansion Area 2 in black and the location of local conservation units that are monitored by PMI in accordance with ZDM to avoid conversion of natural areas with non-natural covers including crop land.
Additionally, Brazil's local environmental regulations require our suppliers and farmers to protect Permanent Protected Areas1 around water bodies and maintain Legal Reserves2 on part of the farmland to support biodiversity. We overlaid these protected areas on our maps to crosscheck they were excluded from the earmarked farming areas and confirmed that the Legal Reserve requirements could be met.
Water risk and biodiversity protection:
Geospatial analysis is also helpful in assessing water risks and biodiversity impacts within our supply chain.
Biodiversity relevance assessments informed by geospatial data consider proximity to protected areas and the presence of endangered species, guiding our efforts to protect ecosystems. Through the program, we have been able to calculate which of our sites (including tobacco-growing areas, manufacturing sites, and procurement locations across pulp and paper and electronics) face key biodiversity pressures outlined by the Task Force for Nature-Related Financial Disclosure. These include land and ecosystem use, water use, pollution, climate change, invasive species and natural habitats.
Further, information we glean from the program can help us to centrally monitor watersheds used as water sources for irrigating tobacco and as water sources for our manufacturing facilities. We are then able to cross reference the associated water physical quality, quantity and regulatory risks, and assess for dependencies with biodiversity-sensitive areas.
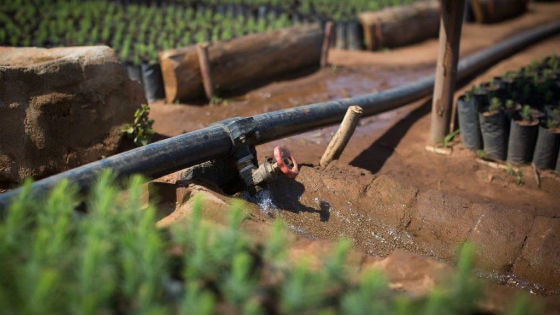
It also helps us to better understand which initiatives may be most effective to reduce water risks and optimize water usage at the watershed level. Notably, geospatial analysis underpins the development and implementation of volumetric water benefit projects in our tobacco supply chain, which aim to tackle shared water challenges in the watershed where our contracted farmers operate.
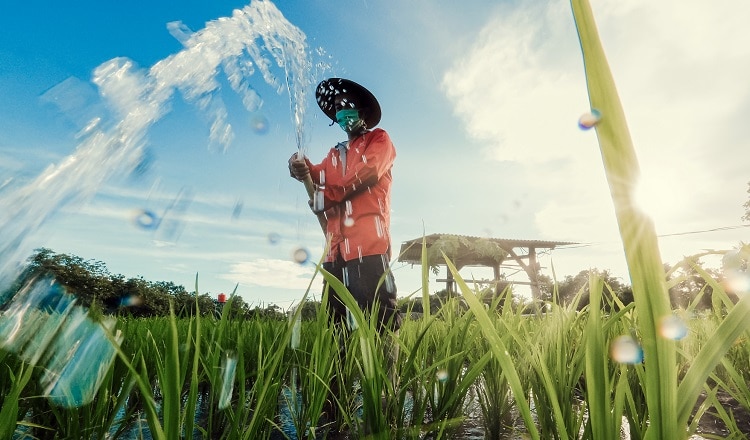
For example, in Italy, we used the program to assess baseline water stress in Umbria and Campania, and later confirmed them through a local water risk assessment. Together with key stakeholders and local evidence, it became clear that regional water stress could be addressed by reducing water use and demand. As a result, we implemented a water optimization project in the region that resulted in 6,858.16 cubic meters of water optimizated per year during the trial. This is because less water was used for watering the fields, meaning less water was taken from the environment for crops, thereby releasing it for other uses in the catchment area.
Projects such as the Brazil Water Guardian—which protects and improves water supplies for local communities—address downstream water impact and also require spatial analysis to work on baselines indicators such as land use, land slope, and relevant precipitation data.
Pre-project evidence from Spring 2018 Brazil Water Guardian project, which uses the Volumetric Water Benefit Accounting methodology to account for benefit from land conservation.
Post-project evidence from Spring 2021 Brazil Water Guardian project showing improved landscape health in the fenced area.
Looking ahead
As our company navigates an increasingly complex landscape of climate, biodiversity, and societal challenges, staying at the forefront of technological advancements is crucial.
PMI works hard to adopt robust practices that not only address immediate challenges but also anticipate future risks and opportunities. By integrating advanced technologies like geospatial mapping, we can make more informed decisions, drive innovation, and progress on efforts to preserve nature.
PMI is continuously advancing its geospatial analysis capabilities to further enhance decision-making and sustainability outcomes.
1Refers to an area that must be preserved, even if not covered by native vegetation, to protect water resources, landscape features, geological stability, biodiversity, facilitate fauna and flora gene flow, conserve soil, and ensure human well-being. APPs are established in several situations, such as hilltops, steep slopes, coastal shrublands (resting as), mangroves, veredas (wetlands in Cerrado), water springs, streams, pounds, and reservoirs. It is forbidden to convert native vegetation in APPs to build infrastructure or develop any kind of agricultural activity; native vegetation can only be suppressed in situations considered of social interest, such as road construction. However, the Native Vegetation Protection Law established mechanisms that may allow continuous farming or maintenance of infrastructure facilities in APPs were native vegetation was already suppressed before 2008. (PDF) A critical analysis of the Native Vegetation Protection Law of Brazil (2012): Updates and ongoing initiatives (researchgate.net))
2 A land portion of a rural property or holding established with the function to ensure sustainable eco-nomic use of natural resources, contribute to the conservation and rehabilitation of ecological process, and support biodiversity conservation. The proportion of farm area set-aside as LR is determined according to the region. (PDF) A critical analysis of the Native Vegetation Protection Law of Brazil (2012): Updates and ongoing initiatives (researchgate.net)


